
Table of Contents
TL;DR to go
- Don't pay attention to the polls until October
- Don't misconstrue a poll's margin of error because they are consistently understated
- The margin simply means that if 46% of voters favor Our Guy with a margin of error = ± 3.5%, then if you repeated the poll, on average you would see results between 42.5% and 49.5% with a "probability" of 95%—meaning once out of 20 samples could be outside the range.
- The simple sampling error is what most polls use, and the larger the number of responses, the smaller the margin. Keep an eye open for n, the number of respondents. Don't be taken in by small samples, say under 1,500. See the table at the end.
- Don't pay attention to nationwide polls. Keep eyes on the purple people eaters that Biden won in 2024 by a combined 310,308 votes out of 155,507,476. That's a little less than 0.2% of the vote.
- Michigan 154,188
- Pennsylvania 80,605
- Nevada 33,596
- Wisconsin 20,682
- Arizona 10,457
- Georgia 10,780
- Understand that the simple sampling error is only part of the story. Other sources of error increase the margin.
- If the reported margin of error is too small for the sample size (see the table in the text) the explanation might be
- Incompetence
- Chicanery
- Being too clever by half
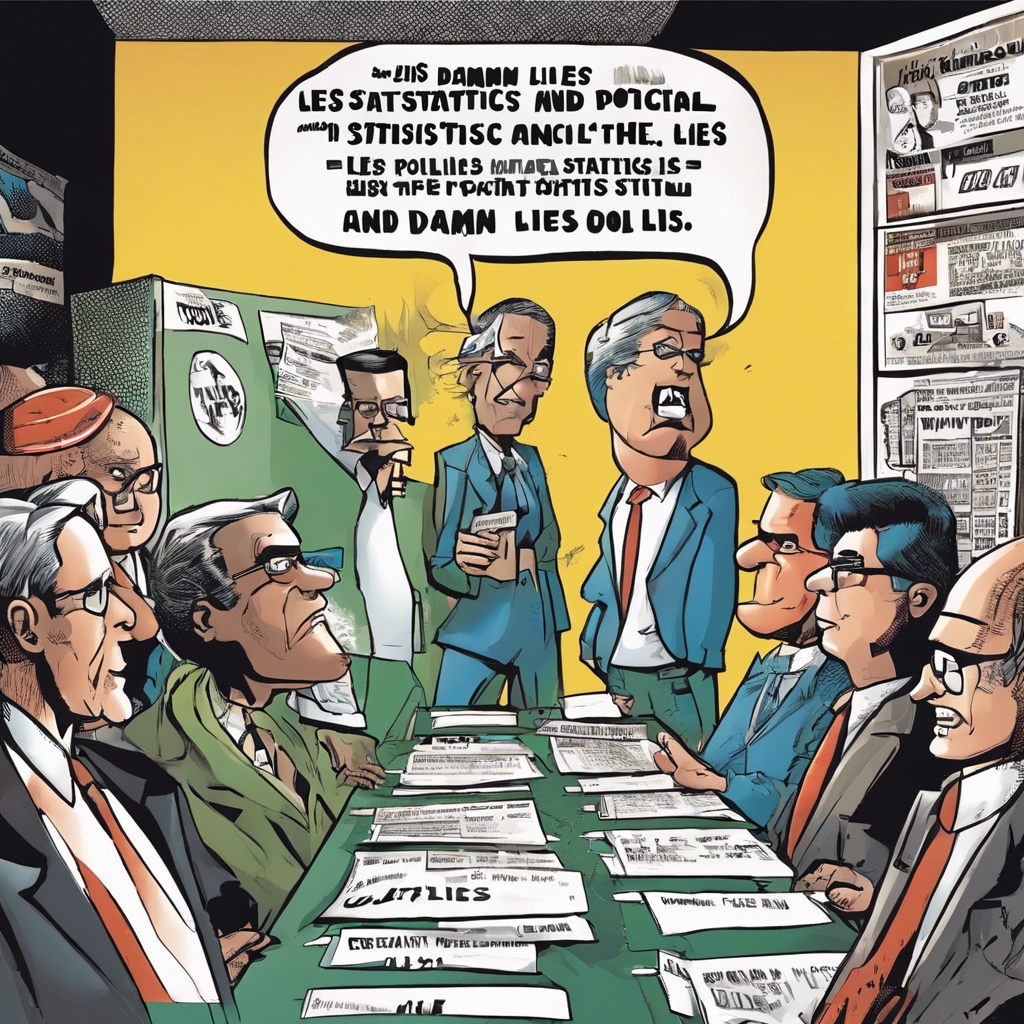
Let's begin with that word lie
| Lies | Damn Lies | Statistics | Polling |
|---|---|---|---|
| alternative fact | barefaced | bullshit | cock and bull story |
| deception | departure from the truth | disinformation | dissimulation |
| exaggeration | fable | fabrication | fairy tale |
| fake news | falsehood | falsification | falsity |
| fib | fiction | figment of the imagination | flight of fancy |
| gossip | half-truth | invention | (little) white lie |
| made-up story | mendacity | misinformation | myth |
| perjury | piece of fiction | pretense | pretext |
| prevarication | propaganda | red herring | sham |
| tall story | tall tale | trumped-up story | untruth |
| whopper | yarn |
As opposed to truth, say. We have really a lot of ways to describe lying and they express the degrees of our disapproval, especially when we find ourselves deceived by the lie.
My title expands a trope from the 19th century of a triptych of untruths, arranged in order of blameworthiness.
In Dante Alighieri's Inferno liars are primarily found in the Eighth Circle, known as Malebolge. This circle is divided into ten ditches or bolgias, each punishing different types of fraud. Liars are specifically punished in the Eighth Bolgia, where their souls are hidden from view, encased in individual flames. He might have had to expand the joint to cover one modern case, statistics.

It's easy to get snookered by something that floods your zone with the trauma of school algebra.
Then comes the worst.
Why we care so much
We can never know about the days to come, but we think about them anyway. Carly Simon
We want to know the future, but it hasn't happened yet
There is no truth to the future, as much as we want there to be.
Shew the things that are to come hereafter, that we may know that ye are gods: yea, do good, or do evil, that we may be dismayed, and behold it together. Isaiah 43:21
There are some things we can reliably predict, such as eclipses, sunrise, sunset and other natural phenomena that fit into the neat package of Newtonian mechanics. But most things don't work in such a straightforward fashion. The best we can do in predicting election results is to understand the limits on just asking people how they are going to vote.

Predictions are either guesses running the gamut from informed to wild ass. Projections and forecasts work from what has been to what may be, based on the notion that the near future will look like the recent past plus a little or minus a little.
We can actually describe how confident we feel about a forecast with confidence bands to indicate where we feel comfortable that there is only a 1:20 chance of missing.
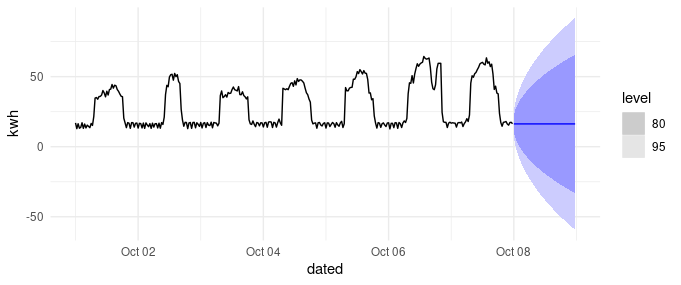
As you go out in the future the confidence bands widen beyond all comfort.
Moral: Don't stretch your data too far into the future.
Stats: who needs 'em
Statistics is what you need to compress large numbers enough to understand them better. Biggest, smallest, mean, median, total all give views that you just can't get directly by looking at thousands of numbers.
The weapon of mass deception
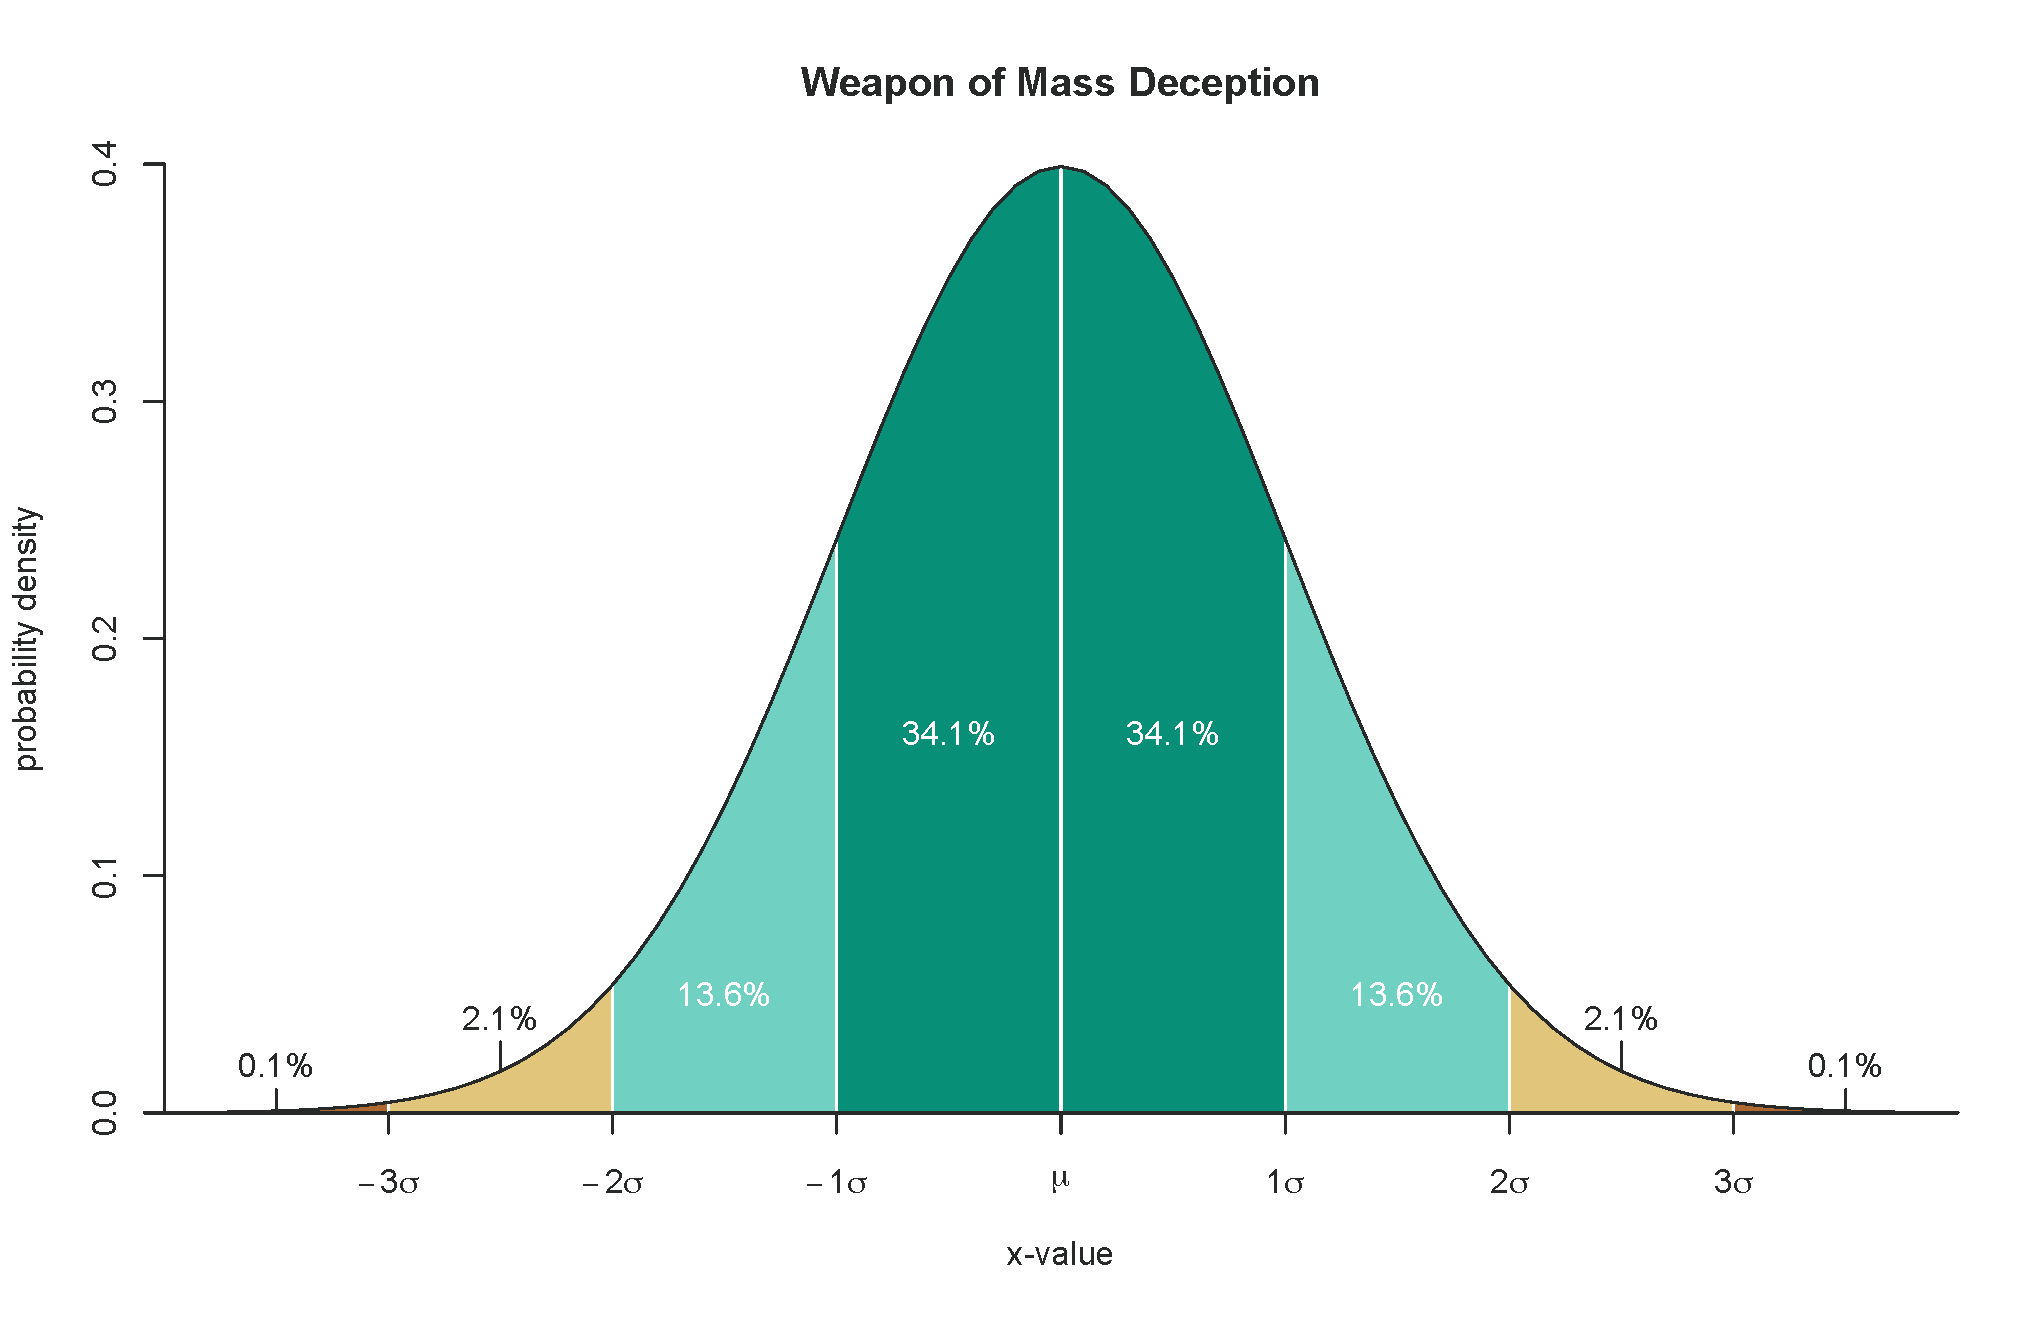
It's hard to escape higher education without having seen the bell curve, also called the normal distribution. Something about two standard deviations, whatever that is, from the mean (average?) being in the upper 5%. It may have been met earlier by the notion of grading on the curve. Along with $\Sigma$, it's what comes to mind for most people when thinking about statistics. STEM graduates may dive deeper into the mysteries to learn about $\mu$, $\bar{x}$, $\sigma^2$, $s^2$, $\sigma$ and $s$. The first set of symbols is the mean of the population, its standard deviation and variance, and the second set is for the corresponding values of the sample.
What's the difference?

Random sampling can approximate a normal distribution even though the population might not be normally distributed.
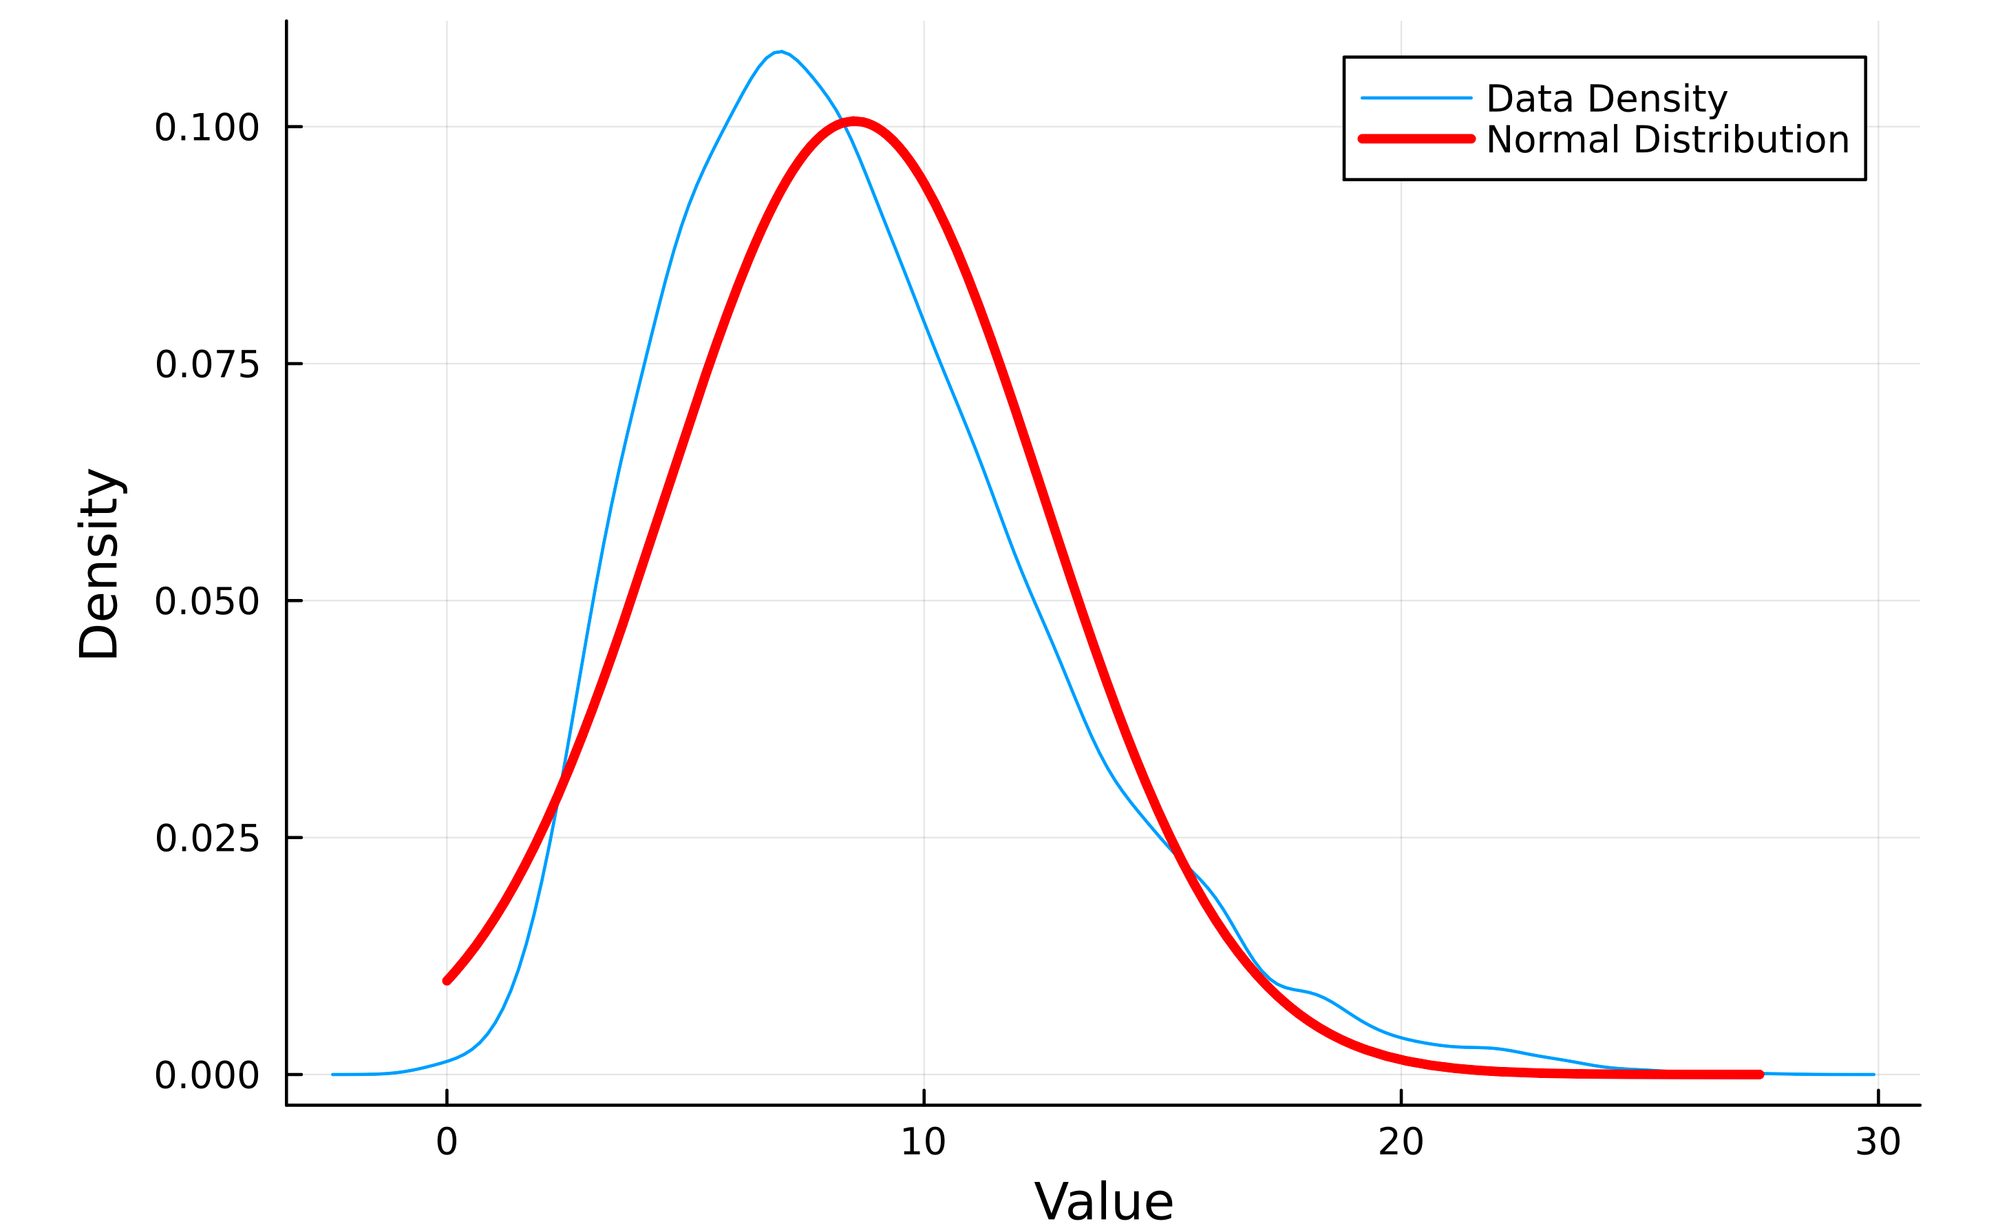
Specifically, the distribution of repeated sample means will approach normality as the sample size increases, even if the population distribution is non-normal. That is, successive sample pulls from the collection of windspeed observations will differ in their means. Sometimes it will be low, say 2 mph, sometimes high, like 20 mph. Most often it will be around 9 mph, which is off from the observed mean of all the observations.
Why do we care?
We can't ask everyone how they are going to vote—that's why we sample. And if we sample randomly, as we should, there is going to be inherent error. That error doesn't include the errors that come from people being confused giving answers, or failure to record or tabulate answers. That's just the error that comes from the fact that random sampling of a non-normal distribution, the difference between the tops of the blue and red curves, their means, is unavoidable.
AKA
The margin of error.
Focus on the bolded while running your eyes quickly over the following: The formula for the 95% margin of error based on the formula for simple random sampling (SRS) is:
Margin of Error (95%) = 1.96 × √((p̂(1 - p̂)) / n)
Where:
- 1.96 is the critical z-value for a 95% confidence level (based on the standard normal distribution)
- p̂ is the sample proportion (an estimate of the population proportion)
- n is the sample size
This formula assumes that:
- The sample is randomly selected from the population (simple random sampling).
- The sample size is large enough (typically n ≥ 30) to invoke the Central Limit Theorem, which ensures that the sampling distribution of the sample proportion is approximately normal.
- The population size is much larger than the sample size (at least 10 times larger) or the population is infinite.
The margin of error represents the range of values above and below the sample estimate (sample proportion) within which the true population parameter (population proportion) is likely to fall with a certain level of confidence (95% in this case).
For example, if a survey finds that 60% of respondents support a particular policy (p̂ = 0.6) with a sample size of 500 (n = 500), the margin of error would be:
Margin of Error (95%) = 1.96 × √((0.6 × (1 - 0.6)) / 500) ≈ 0.0434 or 4.34%
This means that we can be 95% confident that the true population proportion falls within the range of 60% ± 4.34%, i.e., between 55.66% and 64.34%.
The margin of error is a numerator divided by a denominator, so as the denominator gets bigger the margin gets smaller. The bigger the sample, the lower the margin of error.
And that is all the margin of error means. There is 1 chance in 20 that the result reported is, in the example above, greater than 64.34% or less than 55.66%.
So, that's all?
No, the simple random sampling error is not the total error. And most polls only report the simple random sampling error.
The undropped shoes
Frame errors
Frame errors arise when the people asked are different from the target population. The target population is political pollers are voters. The people asked might not be voters or might be unrepresentative.
The classic example example of an unrepresentative sample comes from 1936 with the Depression in full swing.

The Literary Digest was a long-established national magazine that did presidential polls that earned it a reputation for accuracy. In 1936 it sent out 10,000,000 questionnaires to its approximately 1,000,000 readers and 9,000,0o0 others with auto registrations or phone numbers. They got back 2.27 million responses for an election in which 45.7 million votes were cast. For the 2020 election, 158 million votes were cast, so 7.8 million responses would be needed to get that reach. In October 2020, there were fewer than 769,000 voters polled.
However, in 1936, unemployment was nearly 17% and discretionary expenditures for many households did not extend to the costs of magazine subscriptions, automobiles and telephone service. Although the survey received a large number of responses, they pulled from a more well-off demographic.
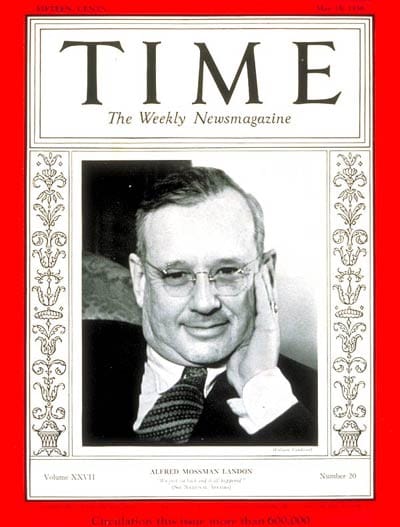
Remember Alf Landon? (My reaction is always that he's the one who's not Al Smith. Like my dad was a teen during these years and mom was a tweener. Their political personalities were not well formed neither of them could vote until after the war. So, Landon and Smith were just names to them.)
The Literary Digest predicted that Governor Landon of Kansas would win with over 57% of the vote. They missed by 39%. The Gallup Poll, using more modern methods was within 1.4% of the result. The governor won only Maine and Vermont. The old catchphrase celebrating Maine as the bellwether of the national result had to be amended.
As goes Maine, so goes Vermont. Jim Farley, DNC Chair
The Literary Digest was no longer around to conduct polls in 1940. Probability based polling was developed to give an equal possibility of reaching everyone who could be reached. However, there is still no way of creating equal probability of response.
Framing errors today

One mainstay of polling has been dialing for dollars, randomly reaching out to voters in hope of engaging them with the survey. I haven't found definitive answers to my perennial question
Aren't these the same people who either don't have caller id or pick up anyway and don't even like live conversations anyway?

Hello, you have reached my voice mail. Please hang up and never call again
Nonresponse errors
Another pit that The Literary Digest fell into was the silent majority even among those who received the unreflectively statistically biased people being polled. Those who did respond had strong feelings about FDR and wanted to share those.
Traitor to his class (the wealthy), "Rosenfeld", opportunist, socialist, tool of the capitalists and That Man in the White House
were sentiments in circulation in the day. "Rosenfeld" was the contribution of Father Charles Coughlin, who played the guilt-by-acoustic association card. Nonresponse goes beyond "meh … can't be bothered." Those surveyed who feel that their candidate is trailing are less likely to respond.
Measurement errors
Voter sentiment changes during the course of the campaign season. Today's views may be different tomorrow. The order in which questions are asked and how they are phrased matters. If questions are shown, look for "leading questions"
Don't you agree that President Biden should have taken stronger action when COVID-19 first became a problem in 2020?
Robocalls taking answers to prompts given solely in English miss many voters.
Specification errors
In addition to trick questions, there are questions easily misinterpreted.
On a scale of 1 to 10, are you less likely or more likely to avoid voting for candidates who fail to do negative campaigning
(Too many polarity flips.)
For surveys that can order questions. There are techniques for checking consistency of answers. Guttman scale analysis is a method used to assess whether a set of items or statements can be arranged in a hierarchical order, such that an individual who agrees with a particular item also agrees with all lower-ranked items. It is often used to measure unidimensional constructs, like attitudes or abilities, where items are arranged in increasing intensity or difficulty. Inconsistencies can be flagged to screen responses.
Problematic methods
A penny for your thoughts. That's about the going price for answering an opt-in online survey on Mechanical Turk, the nano-gig site.
Or, for an upscale campaign, maybe a buck or two. How many respondents click through as fast as possible just taking the top choice, without reading it?
No ground truth
The only margin of error that counts isn't available until the ballots are tallied. It's the ultimate irreproducible experiement.
Aggregation may not improve things
Because 2016. Many polls were making the same mistakes.
Rule of thumb
Double the margin of error before getting too anguished or complacent.
Takeaway

Much less messy than the alternatives.
Appendix
Simple random sampling margins of error by sample size
| Sample Size $$n$$ | Margin of Error (MOE) (%) | With 1.2% allowance for other errors |
|---|---|---|
| 500 | 4.4% | 5.6% |
| 1000 | 3.1% | 5.3% |
| 1500 | 2.5% | 3.7% |
| 2000 | 2.2% | 4.4% |
| 2500 | 2.0% | 3.2% |
| 5000 | 1.4% | 3.6% |
| 7500 | 1.1% | 3.3% |
| 10000 | 1.0% | 3.2% |
| 25000 | 0.6% | 1.8% |
| 50000 | 0.4% | 1.6% |
Remember that when a result is reported within a margin of error, there is a 5% probability that the true value lies outside. So, there's that.
Mascot of the Day


