
Table of Contents
What are the odds?
How much have you got to bet, sailor?
A poll comes out: Biden's approval rating has improved among registered independent voters who are vegetarians by 1.2% nationwide over the past month, with a margin of error of ±3.2%
And what, exactly, to do with that information?
That's the problem, neatly presented
We don't fall asleep like a fairy tale character for 20 years and wake up to refabricate our political identities. There is historical inertia. Think of it this way. Plucked out of a reverie, you find yourself at a Kentucky Derby charity party and the organizers come round to ask your bet. You have absolutely no idea of the odds. All you know about the field is names of horses—Lucky Jim, Bold Marauder, Inside Straight, Solitaire, Organo, Leritine, Ochi Cherney, Implausible and Celestial. No Daily Form, no studbook, no morning line, nada.
Within that naïve information space one wager is as good as another. Sure, you have to bet—that's the whole point of the event. But there are bragging rights at stake. Or maybe a selfie with a celebrity. Besides, you don't want to look the fool. Can you improve on picking a name out of the hat?
Not without more information.
It's a horse race, so no amount of information is going to assure a winning bet but new information can affect the your assessment of the odds.
Lucky Jim is quick out of the gate, but fades in the stretch. Bold Marauder's sire was Thoroughbred Horse of the Year in 2003 …
We are not starting without history
The 2020 election results will never be final for some people, but they are official. Some more official history is that 17 states lost or gained electoral votes following the 2020 Census. With that information we can re-run the 2020 election under 2024 rules. That is a starting point.
What's different this time? Lots
2024 will not be a rematch. For one thing we can safely assume that Mike Pence won't be on the ticket as VP. Much else has changed. Most of it we can't put a number on or, if we can, it's uncertain how much impact it will have on voting.
For example, by conventional measures, the economy is going great guns. Unemployment down, labor force participation up. Inflation up but wages up more. Stock market keeps going up. Dreams of crypto wealth remain unshaken. The usual tippy top of the income pyramid continues to benefit the most and the downtrodden the least. Eggs did top out at \$18/dz but now they can sometimes be found on sale for \$3/dz. It's annoying that so much in the way of food hasn't come down, but all-in-all it hasn't cut into a hefty increase in discretionary spending.
And yet
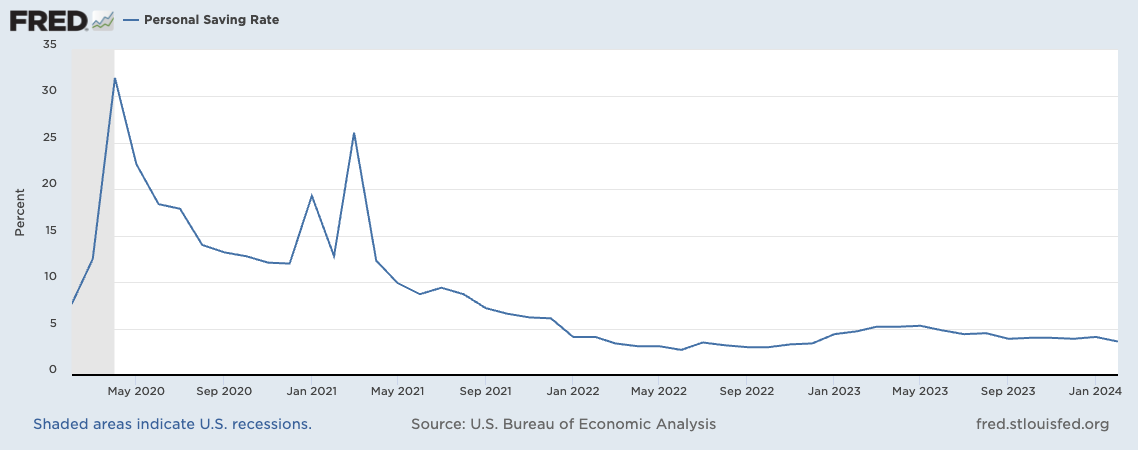
When asked, people seem down on the economy and, as is customary, blame the incumbent. Perhaps this just reflects economic anxiety, rather than economic distress. But, if so, the anxiety seems to be diffuse, because the personal savings rate is back down to pre-pandemic levels, which is not much.
Also, in the 2022 midterms, "the economy" didn't produce the expected Red Wave.
We have surveys
Should we use those yet? Yes, with caution. Surveys are, despite the impressive sounding "margin of error" kind of loosey goosey, especially when each one represents a few hundred people with the patience to put up with 20 or 30 minutes being interviewed or filling out online forms.
Are surveys good evidence of the temperature of the electorate? They can be, and the consistency with which pollsters are reporting the margins supports that.
But
Are surveys evidence of how voters end up voting? Yes.
But
Are surveys the best evidence? No, as the 2016 election showed. And, as a result of that shocker, polling has changed a lot, so a lot of what we knew, or thought we knew, about the reliability of surveys as harbingers of results has yet to be reconfirmed.
In the lead up to the 2020 election, national polls showed Biden with a steady but relatively modest lead over Donald Trump in terms of the national popular vote preferences. However, the state-level polls pointed to a much tighter race in several key swing states.
Yet, there were significant errors in state-level polling in some cases. This included underestimating Trump's support in Florida, Ohio and Iowa among other states. At the same time, state polls proved more accurate than 2016 in other battlegrounds like Michigan, Pennsylvania and Wisconsin which Biden flipped from red to blue.
And
While early election year polls can sometimes signal the overall contours of the race, they tend to become more reliable guides to the final result as more data is gathered closer to election day. However, the degree of change can vary depending on the specific election cycle dynamics.
So, what to take from the state of surveys from March?
We need to add both history and patience. We get history from 2020 and patience from adjusting history each time a new round of polls comes out.
How do we do that?
We can turn to tools of data science that handle just this sort of problem. Take one part past results, add a survey, blend well and out pops an assessment how how things stand. Like this
| State | Electoral Votes | Lower CI | Mean | Upper CI | Expectation | Call |
|---|---|---|---|---|---|---|
| PA | 19 | 0.21 | 0.51 | 0.8 | 9.64 | 19 |
| MI | 15 | 0.23 | 0.51 | 0.8 | 7.7 | 15 |
| GA | 16 | 0.21 | 0.5 | 0.79 | 8.01 | 16 |
| NC | 16 | 0.2 | 0.49 | 0.78 | 7.9 | 0 |
| AZ | 11 | 0.22 | 0.5 | 0.78 | 5.52 | 11 |
| WI | 10 | 0.21 | 0.5 | 0.79 | 5.04 | 10 |
| NV | 6 | 0.23 | 0.51 | 0.8 | 3.07 | 6 |
How to read this
- State is in order of electoral votes
- Electoral votes are slightly different from 2020—Pennsylvania and Michigan each lost one and North Carolina picked up one\
- Lower CI is the lower confidence interval, and they are uniformly low
- Mean is the average estimate from repeating a model 10,000 times
- Upper CI is the upper confidencer interval, and they are uniformly high
- Expectation is the multiplying Electoral Votes by Mean.
- Call is the number of Electoral Votes assuming they go to Biden when the Mean is equal to or greater than 0.5
How to understand this
First off, this is not a preduction, it's an assessment. The modeling implies, but does not demonstrate, that Biden is leading in the six swing states he won, trailing in the one he didn't, the leads aren't large, and they could be much smaller or much bigger.
Doing the math
From the 2020 election results, Biden gets the states and election districts he won except the six swing states he won and Trump gets his states except North Carolina. The seven swing states have 93 votes. If Biden gets 45, he wins. Trump needs 50. There are 70 ways Biden can do this, and Trump has 57 ways. There's one possible tie.
Without both Michigan and Georgia, Biden's only winning path requires winning both Pennsylvania and North Carolina unless he wins Pennsylvania, Arizona, Wisconsin and Nevada. There is no winning combination if he loses in each of Pennsylvania, North Carolina, Georgia and Michigan.
Totaling the Expectation column—Biden's discounted electoral votes—shows a Biden victory with 45 electoral votes or more. That could come about three ways
| WI, GA and PA | 45 | 270 | 268 | Biden |
| WI, PA and NC | 45 | 270 | 268 | Biden |
| AZ, MI and PA | 45 | 270 | 268 | Biden |
What to do with this information
Roll your own assessment. These outcomes are only what the model implies. The model does not specify which of these outcomes is more likely than another. The possible 128 combinations are purely mechanical given the identification of the swing states and the electoral vote framework.
To this, add your own political intelligence. Do you think that the North Carolina governor's race will boost voting turnout? In whose favor? If you feel it likely that Trump will take North Carolina, then focus attention on Pennsylvania, which becomes a must have for Biden. Focus on Georgia and Michigan, because Biden must take one of the two. And focus on Wisconsin and Arizona, because he must also take one of those two, depending on which of Georgia or Michigan he wins.
(Of course it is possible that Biden can win Pennsylvania and both of Georgia and Michigan. That would be 50 electoral votes, resulting in an Electoral College win of 275-263.)
And next?
The March model becomes history and the April polls are the updating data.
Where to find
This and more at Swing Watch, a noncommercial site that produces these model and tracks other swing state election information.
Mascot of the Day


