Table of Contents
A recent tweet
“There is no bubble”

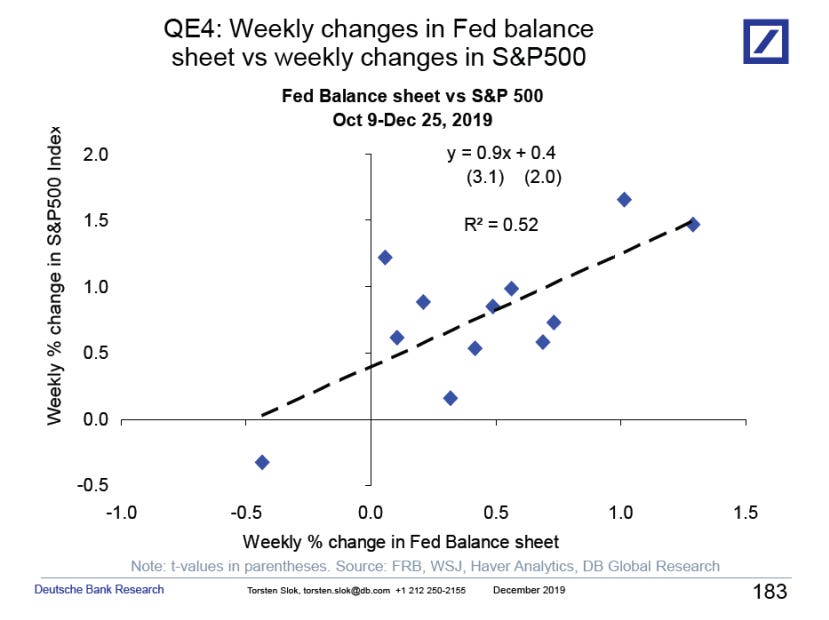
via DB pic.twitter.com/MnMSpE38q2
— Daniel Lacalle (@dlacalle_IA) December 30, 2019
was commented on by Nassim Nicholas Taleb.
The plot was attributed to Deutche Bank Research.
Our ever-helpful friend Fred has two data series, SP500_PCH and WALCL_PCH that cover the same ground, but only up to 2019-12-18, the latest date for which the S&P data was available as of 2019-12-30.
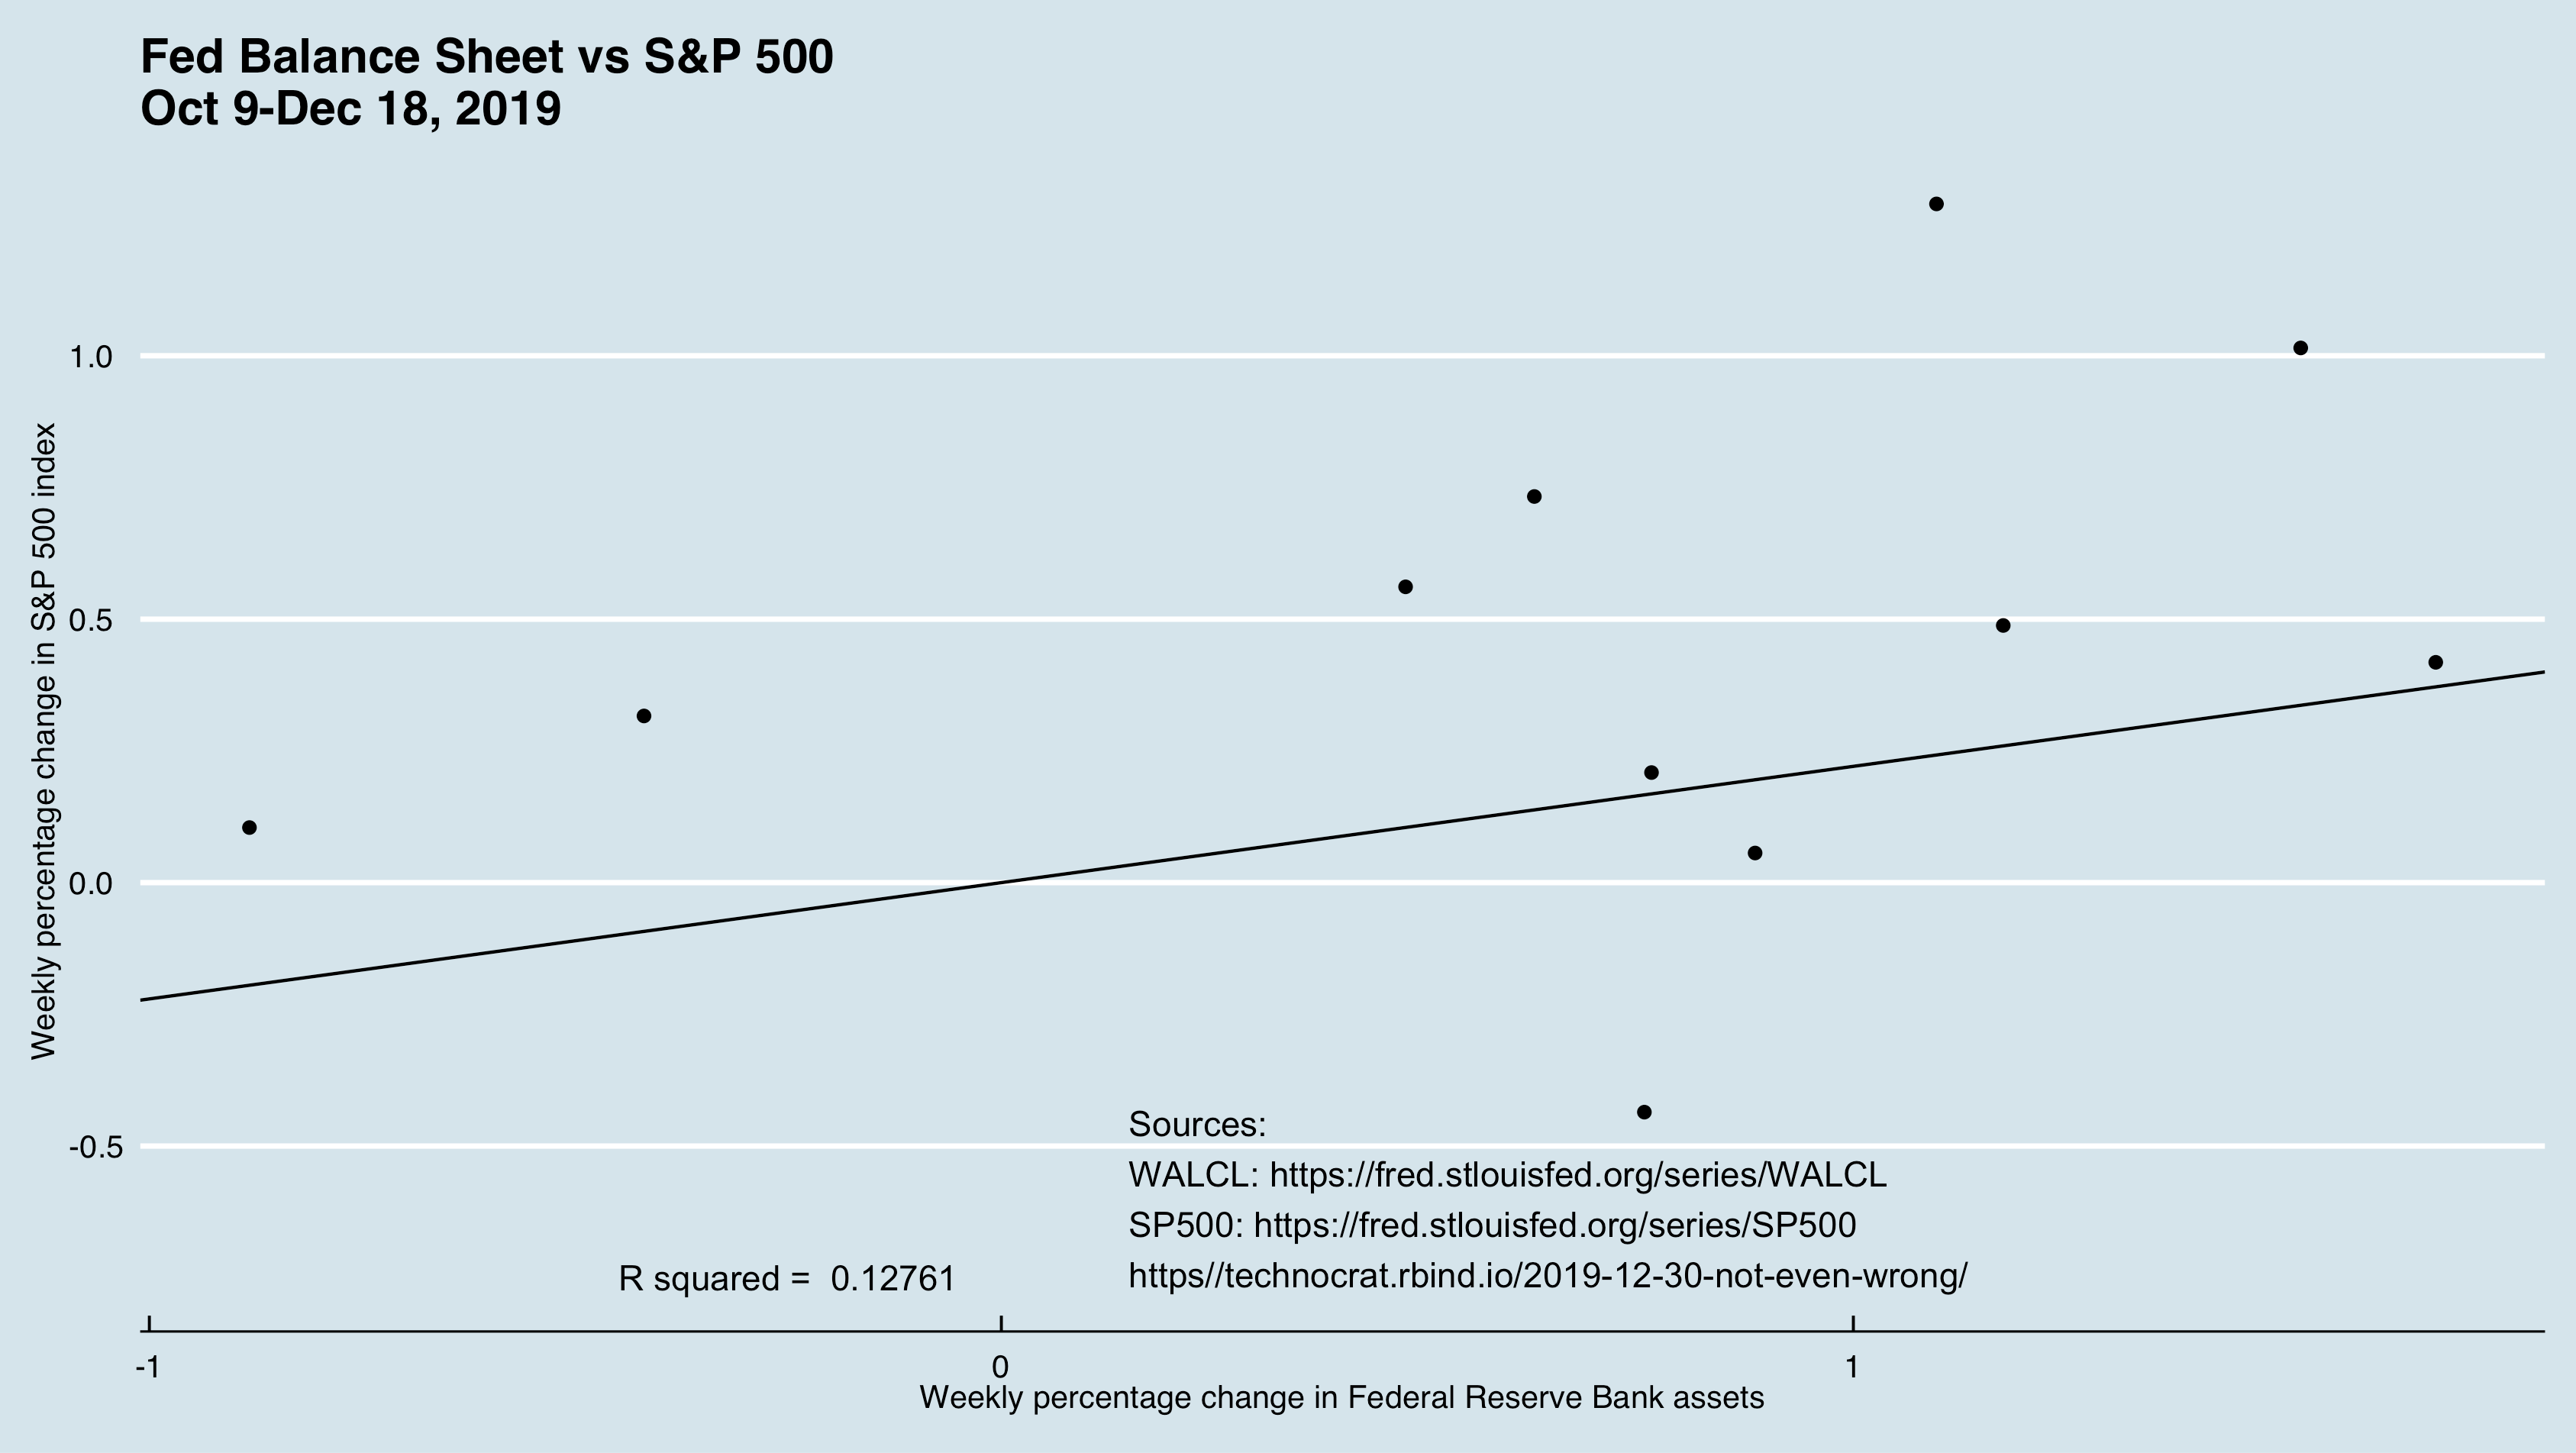
So, let’s see if we can replicate the DB results:
suppressPackageStartupMessages(library(broom))
suppressPackageStartupMessages(library(dplyr))
suppressPackageStartupMessages(library(ggplot2))
suppressPackageStartupMessages(library(ggthemes))
suppressPackageStartupMessages(library(readr))

fed <- read_csv("https://gist.githubusercontent.com/technocrat/d2b231087f35ce987981c98ed5c90042/raw/f266d593bd33c72bcc8f1cb8c0c6415dd6e15fbb/WALCL.csv")
## Parsed with column specification:
## cols(
## DATE = col_date(format = ""),
## WALCL_PCH = col_double()
## )sp <- read_csv("https://gist.githubusercontent.com/technocrat/b93617e7574ff88ddeeb815af529b38c/raw/b9453495b2cf7a55af1ee79806477c0c896eb9f7/SP500_PCH.csv")## Parsed with column specification:
## cols(
## DATE = col_date(format = ""),
## SP500_PCH = col_double()
## )fed_v_sp <- inner_join(sp, fed, by = "DATE")
fit <- lm(formula = WALCL_PCH ~ SP500_PCH, data = fed_v_sp)
slope <- fit$coefficients[2]
r2 <- summary(fit)$r.squared
rsq <- paste("R squared = ",round(r2,5))
sources <- "Sources:
WALCL: https://fred.stlouisfed.org/series/WALCL
SP500: https://fred.stlouisfed.org/series/SP500
https//technocrat.rbind.io/2019-12-30-not-even-wrong/"
heading <- "Fed Balance Sheet vs S&P 500\nOct 9-Dec 18, 2019"
y_lab <- "Weekly percentage change in S&P 500 index"
x_lab <- "Weekly percentage change in Federal Reserve Bank assets"
p <- ggplot(fed_v_sp, aes(SP500_PCH, WALCL_PCH))
my_model_plot <- p + geom_point() + geom_abline(slope = slope) + annotate("text", x = 0.15, y = -0.6, label = sources, hjust = 0) + annotate("text", x = -0.25, y = -0.75, label = rsq) + labs(x = x_lab, y = y_lab) + theme_economist() + ggtitle(heading)
What we used to call a wire house (albeit one whose affiliate is known to have made poorly secured real estate loans) is right and your blogger is wrong, or v.v. or both. One of them may also be bullshit, a proposition offered, according to the philospher Harry Frankfurt not for its truth but simply to influence. See On Bullshit.
The only way to tell, is by the maxim of St. Ronald доверяй, но проверяй by one’s own replication. After all, it’s hard to exclude the possibility that neither model is well-formed, and, more importantly, that neither may be particularly useful as an insight.
It’s also worth taking a look at the p-value of the F-statistic for my model: 0.281 – not even close to the α=0.05 laugh test.


